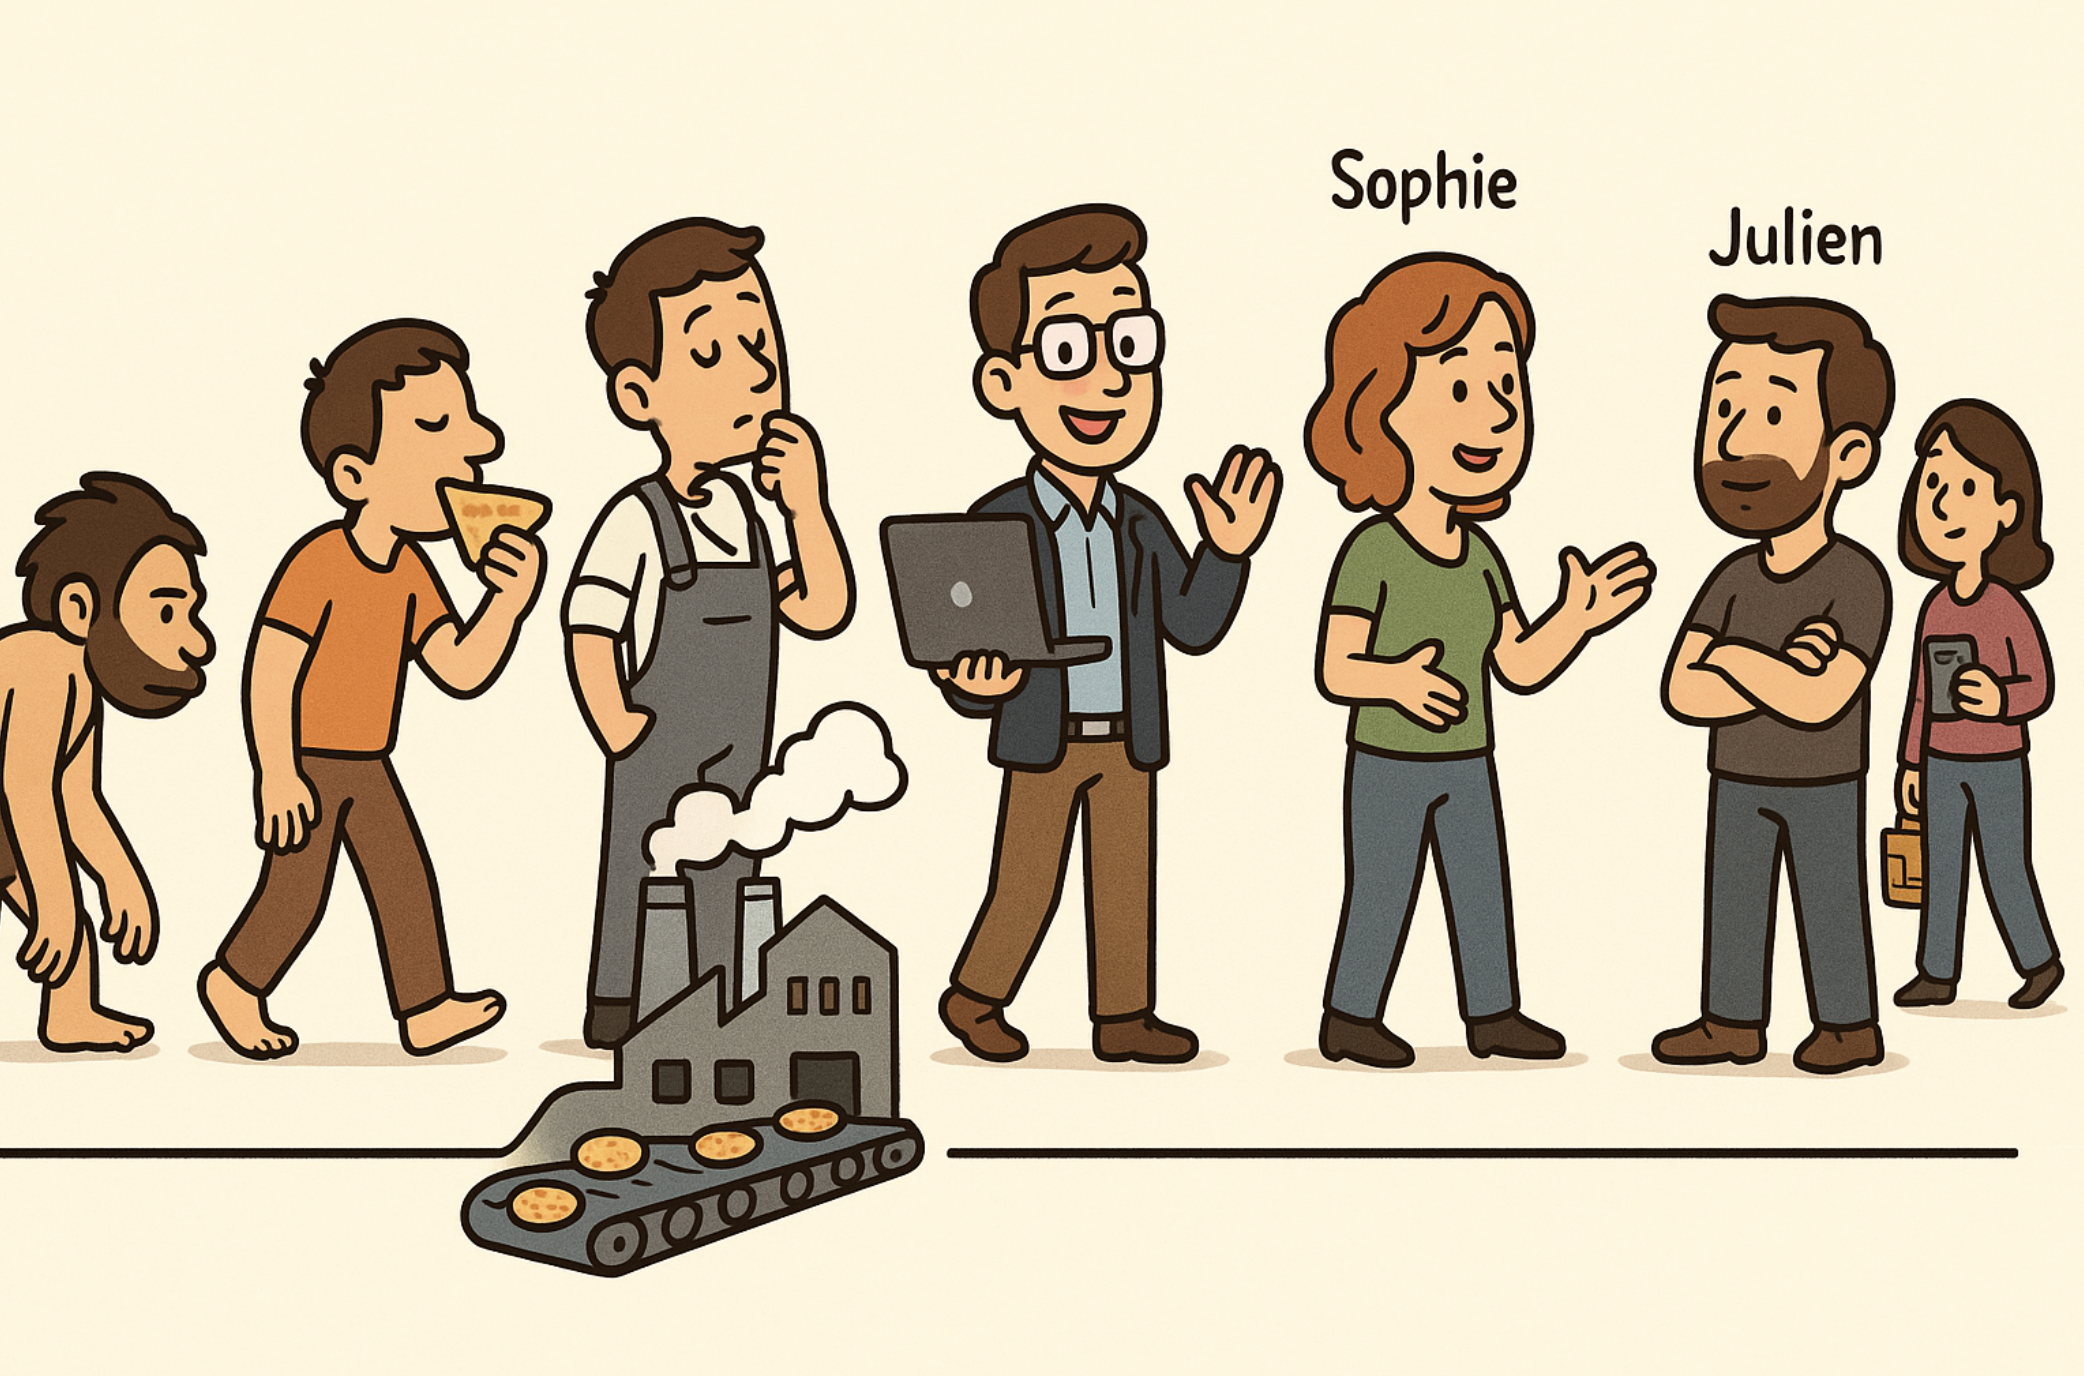
Take the example of a team that decides to visit a school cafeteria to identify areas for improvement. Before putting forward the slightest idea or solution, it takes the measure of reality. On site, it observes: meal preparation, the line, the staff’s movements, the children’s reactions to their plates. It talks with everyone: the cook, the teachers, the students, and even the cleaning staff, silent witnesses of the leftovers piling up. Each one brings a piece of the puzzle: the pressure of the service, the difficulty of anticipating quantities, supply constraints, or the children’s very strong tastes. “Fries are the only thing they eat,” the caterer lets slip, half amused, half disillusioned.
But measuring is not just observing. The team broadens its view through comparative monitoring: it looks into the practices of other schools, innovations in institutional catering, public policies, and anti-waste initiatives already tested elsewhere. This exploration allows it to put into perspective what it saw in the field: what is specific to the cafeteria observed and what belongs to structural trends.
This phase is often part of a test, even an informal one. To keep our introduction simple, let’s assume here that the team leaves with a set of raw data (observations, testimonies, figures, photos, impressions) that will serve as the foundation for what follows. Because in real life, everything starts this way: before launching a structured and precise approach, you first have to discover the field and make room for the informal.
From the very first conversations, the finding is clear-cut:
Nearly 30% of the food served ends up in the trash.
Staff turnover reaches 60% every six months, making any continuity difficult.
The supplier imposes the menus in the name of logistics optimization.
Parents started a petition after several sudden closures of the cafeteria.
The meals do not always match the tastes or specific diets of the children (vegetarian, allergies, etc.).
The service hours are too tight: children eat fast or not at all.
Leftovers are neither weighed nor analyzed: the waste remains abstract.
Dialogue between cooks, teachers and management is almost nonexistent.
The tracking tools (orders, stock, feedback) are aging and barely used.
Staff morale is low, between work overload and lack of recognition.
The picture is complex, almost discouraging. Yet an entry point has to be chosen. Not all the consequences are known yet, but the primary mission of a cafeteria is clear: feeding the children. Throwing away nearly a third of the meals prepared directly contradicts this mission. The team therefore decides to prioritize this central problem: Reduce the amount of food wasted each day.
First hypotheses formulated:
The children don’t eat because the food is of poor quality.
The servers put too much food on the plates.
The children’s eating habits are not suited to the dishes offered.
The cooks lack time to prepare the meals properly.
The menus imposed by the supplier lack local flexibility.
The dishes are served at the wrong temperature, which puts the children off.
The meals are not presented attractively.
Poorly adjusted meal times reduce the time for eating.
The staff is not trained in the principles of fighting waste.
There is no structured feedback loop between kitchen and dining room to adjust quantities.
Priority questions to explore:
Which dishes are most often wasted, and why?
What exact amount of food is thrown away each day?
How do the children perceive the quality and variety of the meals?
What room for maneuver exists with respect to the supplier?
What data can be tracked to measure the progress made?
The team members all come from the world of software development. None of them has worked in institutional catering, but they all have mixed memories, sometimes even bitter ones, of their meals in the school cafeteria. This personal experience, combined with their engineers’ curiosity, naturally drew their attention to this subject.
For now, their vision remains modest, almost embryonic. It rests on what they observed during their first investigation: massive waste, questionable perceived quality, and an organization constrained by logistics more than by taste. They sense that the problem goes beyond the kitchen: it touches on food culture, education, and coordination between actors.
Their intuition, still vague, is that there is a way to put digital technology at the service of better school food: a decision-support tool, an awareness tool, or perhaps a tool to measure waste. But for now, this lead is only a moral compass, not a roadmap.
In the background, a typically French pride guides them: the desire to pass on, from the youngest age, a healthy and informed relationship with the culinary arts, a symbol of education and conviviality.
The strategy, for the moment, remains open and exploratory. The team chooses not to look for the solution, but to look for where it could be useful. Its objective is not yet to build, but to understand before acting.
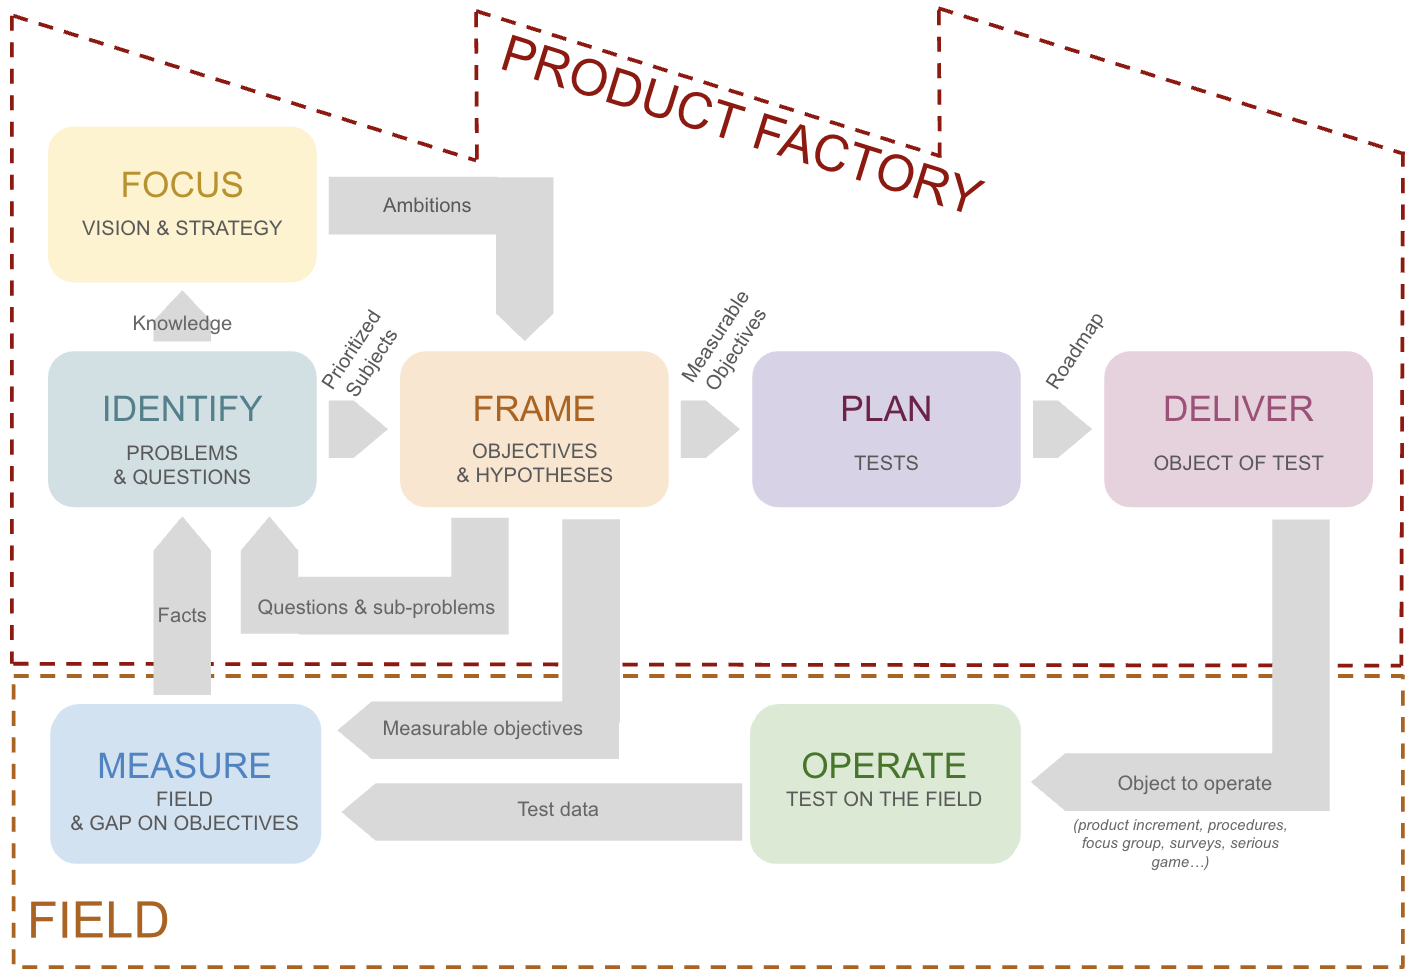
After exploring the field and clarifying its direction, the team must now frame its exploration. The starting point remains the same: the problem observed, the questions asked, and the hypotheses formulated. But to move forward, this understanding has to be turned into measurable objectives, directly linked to the waste reduction strategy.
Main objective: reduce food waste.
This long-term objective breaks down into concrete questions:
What is the acceptable target waste rate for a school cafeteria?
Why is so much food thrown away?
Which levers can really change the situation?
And finally, how can this improvement be turned into value: in terms of quality of service and environmental impact, but also of a business model for the project team?
Intermediate objectives:
Conduct an in-depth field survey with 50 students, to gather their perception of waste, of meal quality and of their food preferences.
Check the hypotheses formulated during the previous phase:
The children don’t eat because of the poor quality of the food.
The servers put too much food on the plates.
The children’s eating habits are not aligned with the menus offered.
The cooks lack time to prepare the meals properly.
New hypotheses to test:
If the students see the volume of food thrown away every day, they will naturally adapt their behavior.
If the cooks have reliable daily data, they will be able to better anticipate the quantities to prepare.
Priority targets to pursue:
Identify the 3 to 5 main causes responsible for 80% of the waste.
Identify 5 concrete levers for action (organizational, educational or technological).
Define a realistic target waste rate, measurable and achievable in the medium term.
Ideation on tests
For each of the objectives defined above, the team lists the possible activities:
Objective: Identify the main causes responsible for 80% of the waste
Test 1: School exit survey Description: interview 50 students as they leave school to find out whether they finish their plates and, if not, understand why. Expected result: a qualified list of the perceived causes of waste. Owner: “Field & Data” lead. Execution role: two team members to administer the questionnaires. Estimated cost: 2 person-days.
Test 2: Immersive observation in the cafeteria Description: share six meals with six different groups of students to observe behaviors and discuss the meals in situ. Expected result: contextualized identification of the real causes of waste. Owner: “User research” lead. Operating role: the whole team in rotation, accompanied by a lead teacher. Estimated cost: 3 person-days + price of the meals.
Objective: Identify five concrete levers for action
Test 1: Interview with cafeteria management Description: talk with the director to inventory the actions already attempted and their results. Expected result: feedback on the levers already tested. Owner: “Institutional relations” lead. Estimated cost: 0.5 person-day.
Test 2: Conditional dessert Description: serve dessert only after the main course is finished, for one service. Expected result: rate of finished plates. Owner: “Field test operations” lead. Stakeholders: serving staff, management. Estimated cost: 1 person-day.
Test 3: Collective ideation workshop Description: bring together the cafeteria staff and two volunteer parents to come up with new levers for action. Expected result: a list of actions ranked by confidence level. Owner: innovation facilitator. Facilitator: a team member trained in facilitation. Estimated cost: 3 person-days.
Objective: Define a target waste rate for a school cafeteria
Test 1: Benchmark across schools Description: contact ten directors of well-regarded cafeterias to learn their average waste rate. Expected result: a reference value. Owner: “Monitoring and Benchmark” lead. Estimated cost: 1 person-day.
Test 2: Putting the target threshold into practice Description: continue the project with an objective of 5% waste at most, then measure whether this threshold is reached. Expected result: validation or revision of the target rate. Owner: “Impact analysis” lead. Estimated cost: 1 person-day.
Once the possible tests are listed, the team enters a key phase: planning the experiments. The challenge is no longer just knowing what to test, but how, with whom and why.
Selection and trade-offs
With an exploratory budget capped at 6 person-days, the team has to make choices. After discussion, it keeps three tests judged the most promising and the best balanced in effort/impact:
Immersive observation in the canteen (3 person-days)
Interview with the principal (0.5 person-day)
Collective ideation workshop (3 person-days)
A budget negotiation keeps all three experiments in scope. The owners and contributors are appointed:
one person in charge of defining the test,
another for creating the material (questionnaires, scripts, supporting documents),
a third for running the test and collecting the data,
and one member dedicated to analysis and reporting.
The stakeholders (management, staff, parents, students) are identified, informed and included in the schedule. The test roadmap is updated to synchronize them over six weeks, with validation milestones and moments for sharing what has been learned.
Once the tests are planned and validated, it is time to deliver. Delivering, here, does not mean shipping a finished product, but making operational what will allow us to learn: the object of test. Each test becomes a mini-project, with its own resources, deliverables and internal validations.
1. Specify the test
Before any design work, the team formalizes the framework of each experiment. This specification acts as a contract between intention and execution. Depending on the nature of the test, it takes different forms:
a design brief for building a prototype (objectives, context, audience, constraints, success criteria);
a protocol sheet describing how a field test runs (location, duration, equipment, instructions, identified risks);
a user story and/or EPICs for technical development (“As a cook, I want to see the amount of food thrown away each day so I can adjust my preparations”);
an interview or focus group plan for qualitative exchanges;
a workshop template for co-ideation sessions.
These documents keep all the project’s participants consistent with each other and make it possible to validate the hypotheses before producing anything.
2. Design and prepare the resources
Different resources are then created for each selected test:
Immersive observation in the canteen
Preparation of an observation questionnaire and a tracking table of the quantities eaten by each student.
Coordination with the teachers to schedule the six days.
Creation of a semi-structured interview guide and a shared notes file to centralize the feedback.
Scheduling the meeting and sharing the minutes in the project space.
Collective ideation workshop
Opening a FigJam account and designing a workshop template, dry-run with two team members (three successive rounds of improvement).
Sending a Doodle to find a date that suits the participants (staff + parents).
Preparing the facilitation material (rules of the game, idea canvas, timer, summary sheet).
3. Implement and check before operating in the field
Before any rollout, the team runs acceptance testing on its deliverables. Each resource is tested under simulated conditions:
Does the questionnaire work without ambiguity?
Does the collection file follow the expected formats?
Is the FigJam template smooth and easy to understand?
Will the success indicators be measurable at the end of the test?
This adjustment step, sometimes neglected, guarantees the reliability of future learning: a poorly prepared test produces unusable data. In a more advanced project, this phase could have included setting up an interactive prototype or a measurement dashboard in real conditions.
The purpose of delivery is not the deliverable, but the production of the knowledge that will feed future decisions to move forward.
Once the data has been collected, the team meets to compare the observed reality with the initial strategy. The tables are displayed, the verbatim quotes reread, the photos and charts spread out on the table. Little by little, the gaps appear. Some hypotheses are confirmed, others collapse, and several gray areas call for a new look.
The first findings speak for themselves:
The students do not reject the food because of its quality, but for lack of time to eat.
The canteen staff want to adjust the portions, but the supplier contracts block any flexibility.
The cooks lack information on the quantities to plan, but not the will to improve.
Parents and staff share the same objective, but no channel allows them to act together.
These lessons show that waste is not just an operational problem: it is a system of poorly aligned constraints. The team then realizes how far the mission it had set itself (“reduce waste”) goes beyond the simple act of eating. It touches on governance, communication, and even educational culture.
From these findings, several avenues open up:
Redefine the vision, by including the cultural and collective dimension of the problem.
Revise the strategy, by targeting the levers of influence rather than the visible symptoms.
Launch a new series of tests, this time geared toward co-building a concrete solution (tracking tool, display system, menu management app…).
Formulate new hypotheses, for example:
“If the waste data is displayed to everyone every day, collective behavior will change naturally.”
“If canteens have an instant feedback tool, they will be able to adjust their menus in real time.”
This identification work marks the return to the starting point, but with a finer, deeper, more systemic understanding.
Laid out as a kanban, this gives the following steps:




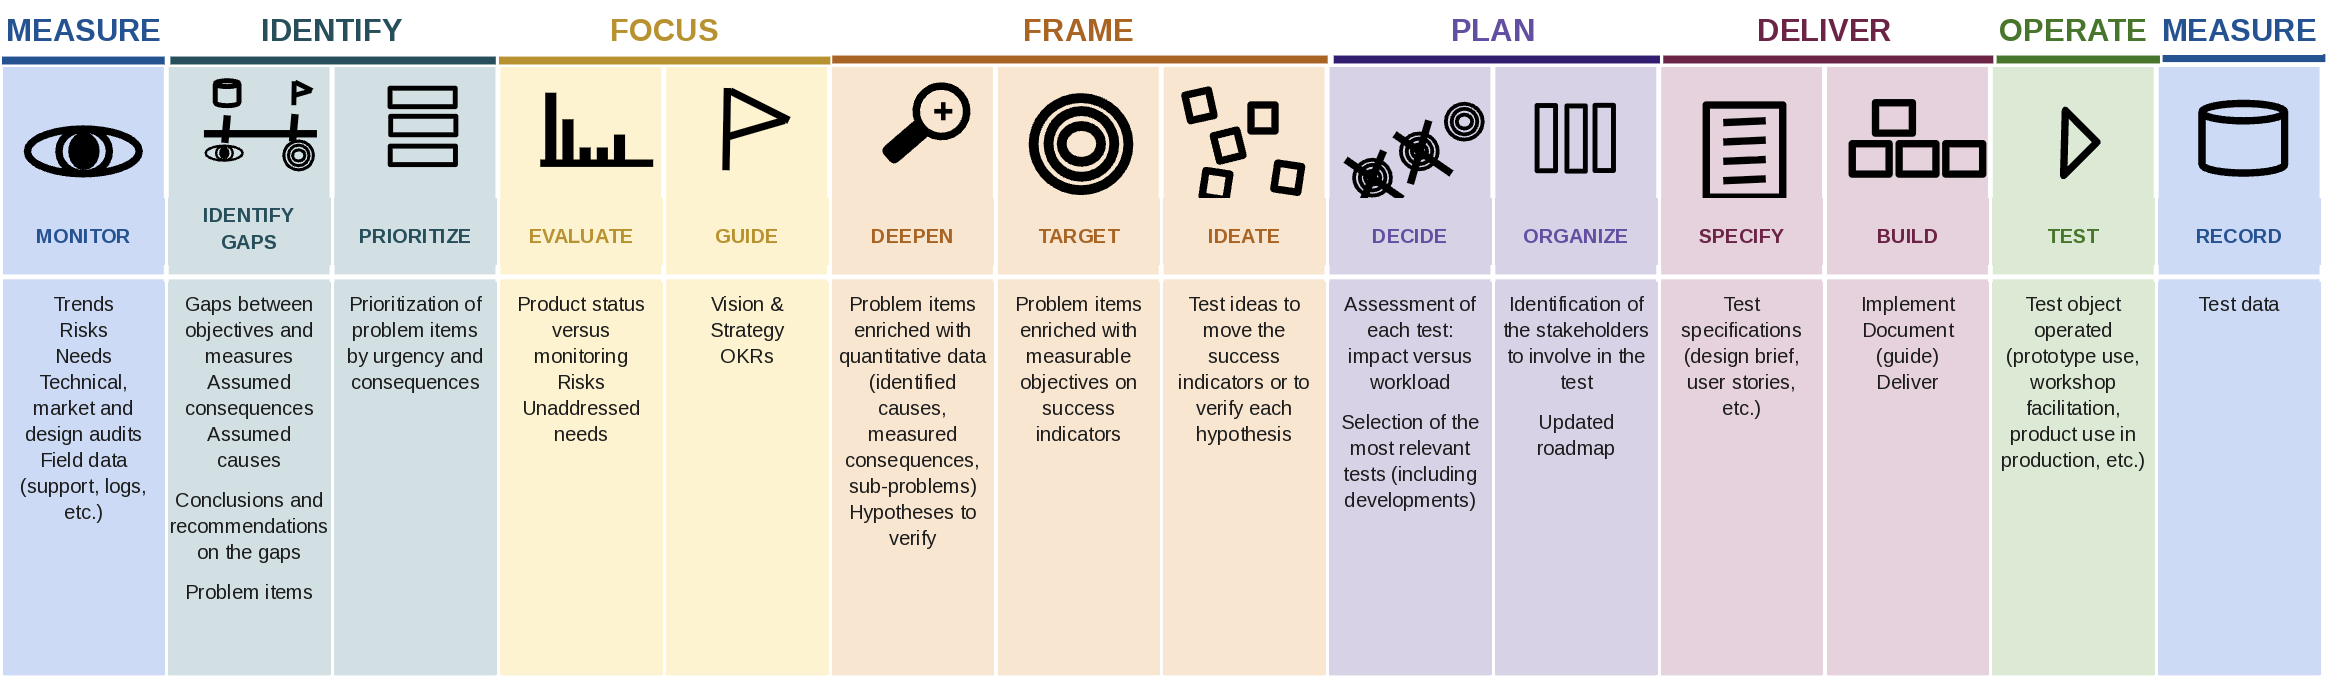







 CC BY-SA 4.0