

Imagine a house in winter. Outside, the wind whistles against the windows. Inside, the temperature is slowly dropping. The thermostat detects that the room is at 18°C, while the set point is 20°C. Immediately, a command is sent: the heating turns on.
A few minutes later, the heat spreads. But if the system stops too late, the room will become stifling; too early, and it will remain freezing.
To avoid these fluctuations, engineers have designed a more subtle mechanism: PID, which stands for Proportional-Integral-Derivative. This regulator does not react blindly. It observes the difference between the setpoint (what we want to achieve) and reality (what we measure), commands an adjusted action, then corrects continuously thanks to constant feedback. The result: the temperature remains stable, comfort is sustained, and consumption is controlled. The system has found its dynamic equilibrium.
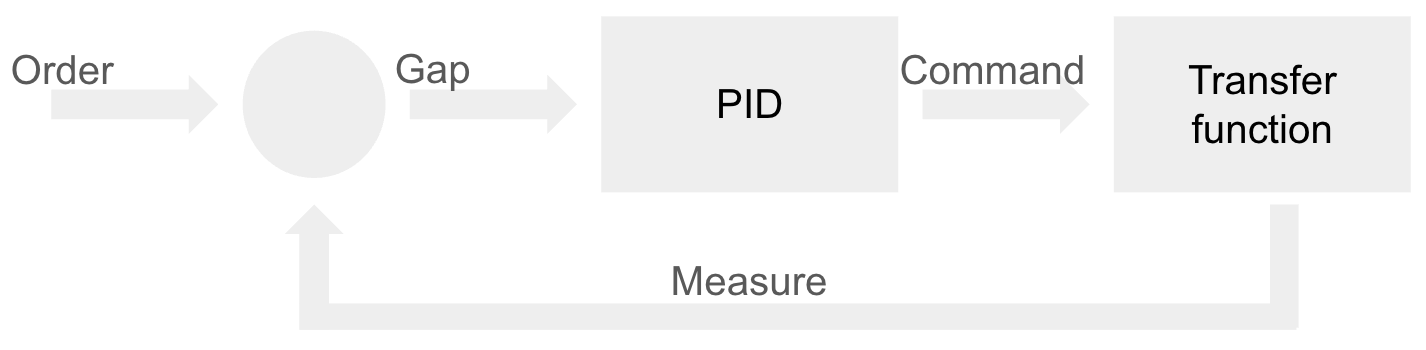

This is exactly what an impact factory does, but on the scale of a human organization. It starts from the same observation: there is always a gap between the current situation and the target ambition. Rather than rushing around or following a passing intuition, it sets up its own control loops: observe, measure, adjust, learn. Every action becomes a feedback signal. Every gap is an opportunity for adjustment. And, like a thermostat that learns to maintain the right temperature, the impact factory learns to stay on course—neither too hot nor too cold, but always moving toward a balance between impact, efficiency, and learning.
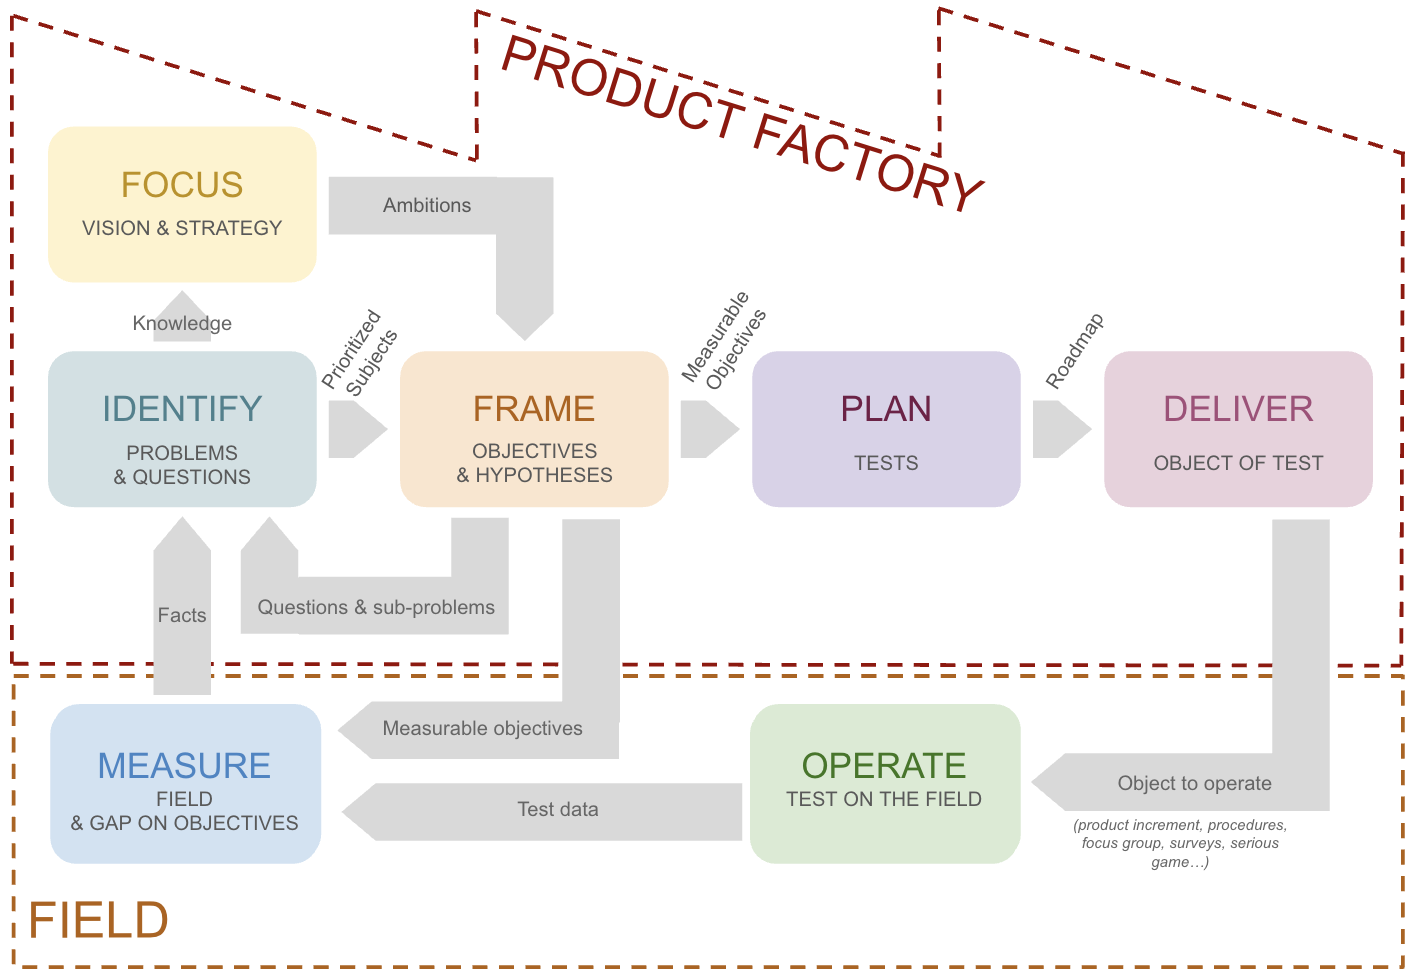
The product factory

Let’s take the example of a team that decides to visit a school cafeteria to identify areas for improvement.
Before coming up with any ideas or solutions, they take stock of the situation. On site, they observe: meal preparation, the queue, the staff’s actions, the children’s reactions to their food. They talk to everyone—the cook, the teachers, the students, and even the janitors, who are silent witnesses to the accumulated leftovers. Everyone contributes a piece of the puzzle: the pressure of service, the difficulty of anticipating quantities, supply constraints, or even the very strong tastes of the children. “French fries are the only thing they eat,” says the restaurant owner, half-amused, half-disillusioned.
But measuring is not just about observing. The team broadens its vision through comparative monitoring: it learns about the practices of other establishments, innovations in collective catering, public policies, and anti-waste initiatives already tested elsewhere. This exploration allows them to put into perspective what they have seen in the field: what is specific to the cafeteria they observed and what is part of structural trends.
This phase is often part of a test, even an informal one. To simplify our introduction, let’s consider here that the team leaves with a set of raw data—observations, testimonials, figures, photos, feelings—which will serve as a basis for the rest of the process.
Because in real life, this is how it all begins: before launching a structured and precise approach, you first have to explore the field and leave room for the informal.

From the very first discussions, the conclusion was clear:
- Nearly 30% of the food served ends up in the trash.
- Staff turnover reaches 60% every six months, making continuity difficult.
- The supplier imposes menus in the name of logistical optimization.
- Parents launched a petition after several sudden closures of the cafeteria.
- The meals do not always correspond to the tastes or specific diets of the children (vegetarians, allergies, etc.).
- The service times are too tight: children eat quickly or not at all.
- The leftovers are not weighed or analyzed: waste remains abstract.
- There is virtually no dialogue between cooks, teachers, and management.
- The monitoring tools (orders, stocks, returns) are outdated and underused.
- Staff morale is low, between work overload and lack of recognition.
The picture is complex, almost discouraging. However, a starting point must be chosen.
Not all the consequences are yet known, but the primary mission of a cafeteria is clear: to feed children.
Throwing away nearly a third of the meals prepared directly contradicts this mission.
The team therefore decides to prioritize this central problem:
- Reducing the amount of food wasted each day.
Initial hypotheses formulated:
- Children do not eat because the food is of poor quality.
- Waiters put too much food on plates.
- Children’s eating habits are not suited to the dishes on offer.
- Cooks lack the time to prepare meals properly.
- The menus imposed by the supplier lack local flexibility.
- Dishes are served at the wrong temperature, which discourages children.
- Meals are not presented in an attractive way.
- Poorly adjusted meal times reduce the time available for eating.
- Staff are not trained in the principles of waste reduction.
- There is a lack of structured feedback between the kitchen and the dining room to adjust quantities.
Key questions to explore:
- Which dishes are most often wasted, and why?
- How much food is thrown away each day?
- How do children perceive the quality and variety of meals?
- What leeway is there with regard to the supplier?
- What data can be tracked to measure progress?

The team members all come from the world of software development. None of them have worked in institutional catering, but they all have mixed—sometimes even bitter—memories of their meals in the cafeteria. This personal experience, combined with their curiosity as engineers, naturally drew their attention to this subject.
For now, their vision remains modest, almost embryonic. It is based on what they observed during their initial investigation: massive waste, questionable perceived quality, and organization constrained by logistics rather than taste.
They sense that the problem goes beyond the kitchen: it touches on food culture, education, and coordination between stakeholders.
Their intuition, still vague, is that there is a way to use digital technology to improve school meals—a tool for decision-making, awareness-raising, or perhaps measuring waste.
But for now, this idea is only a moral compass, not a roadmap.
In the background, a typically French pride guides them: the desire to pass on, from an early age, a healthy and informed relationship with the culinary arts, a symbol of education and conviviality.
For the moment, the strategy remains open and exploratory.
The team has chosen not to look for the solution, but to look for where it could be useful. Its goal is not yet to build, but to understand before acting.

After exploring the field and clarifying its direction, the team must now frame its exploration.
The starting point remains the same: the problem observed, the questions asked, and the hypotheses formulated.
But to move forward, this understanding must be transformed into measurable objectives directly linked to the waste reduction strategy.
Main objective: reduce food waste.
This long-term objective can be broken down into specific questions:
- What is the acceptable target waste rate for a school cafeteria?
- Why is so much food thrown away?
- What levers can really change the situation?
- And finally, how can we leverage this improvement: in terms of service quality, environmental impact, but also as a business model for the project team?
Intermediate objectives:
- Conduct an in-depth field survey of 50 students to gather their perceptions of waste, meal quality, and food preferences.
- Verify the hypotheses formulated during the previous phase:
- Children do not eat because of the poor quality of the food.
- Waiters put too much food on plates.
- Children’s eating habits are not aligned with the menus offered.
- Cooks lack the time to prepare meals properly.
New hypotheses to test:
- If students see the amount of food thrown away every day, they will naturally adapt their behavior.
- If cooks have reliable daily data, they will be able to better anticipate the quantities to prepare.
Priority targets to pursue:
- Identify the 3 to 5 main causes responsible for 80% of waste.
- Identify 5 concrete levers for action (organizational, educational, or technological).
- Define a realistic, measurable, and achievable target waste rate in the medium term.

Once the objectives have been defined, the team enters a key phase: planning the experiments.
The challenge is no longer just knowing what to test, but how, with whom, and why.
Each test becomes a micro-project, with a scope, a manager, and a measurable objective.
For each of the objectives defined above, the team identifies the possible activities:
Objective: Identify the main causes responsible for 80% of waste
- Test 1 — School exit survey Description: Survey 50 students as they leave school to find out if they finish their meals and, if not, understand why. Expected result: qualified list of perceived causes of waste.Owner: “Field & Data” manager.Execution role: two team members to administer the questionnaires.Estimated cost: 2 days.human.
- Test 2 — Immersive observation in the cafeteria Description: share six meals with six different groups of students to observe behaviors and discuss meals in situ. Expected result: contextualized identification of the real causes of waste.Owner: “User Research” manager.Operational role: the entire team in rotation, accompanied by a reference teacher.Estimated cost: 3 days.human + cost of meals.
Objective: Identify five concrete levers for action
- Test 1 — Interview with cafeteria management Description: Discuss with the manager to take stock of actions already attempted and their results.Expected result: Feedback on levers already tested.Owner: “Institutional Relations” manager.Estimated cost: 0.5 person-day.
- Test 2 — Dessert packaging Description: Offer dessert only after the main course has been finished, during one service.Expected result: Percentage of dishes finished.Owner: Field Test Operations Manager.Stakeholders: Service staff, management.Estimated cost: 1 person-day.
- Test 3 — Collective ideation workshop Description: Bring together cafeteria staff and two volunteer parents to come up with new courses of action.Expected result: List of actions ranked by level of confidence.Owner: Innovation facilitator.Facilitator: A team member trained in facilitation.Estimated cost: 3 human days.
Objective: Define a target waste rate for a school cafeteria
- Test 1 — Benchmark between establishments Description: Contact ten directors of reputable cafeterias to find out their average waste rates.Expected result: Reference value.Owner: “Monitoring and Benchmarking” manager.Estimated cost: 1 person-day.
- Test 2 — Implementation of the target threshold Description: Continue the project with a target of 5% maximum waste, then measure the achievement of this threshold.Expected result: Validation or revision of the target rate.Owner: Impact Analysis Manager.Estimated cost: 1 person-day.
Selection and arbitration
Faced with an exploratory budget capped at 6 human days, the team must make choices.
After discussion, it selects three tests deemed the most promising and balanced in terms of effort/impact:
- Immersive observation in the cafeteria (3 human days)
- Interview with the director (0.5 human days)
- Collective ideation workshop (3 human days)
Budget negotiations allow these three experiments to remain within the scope. The owners and contributors are designated:
- one person responsible for defining the test,
- another for creating the materials (questionnaires, scripts, supports),
- a third for the operation and data collection,
- and one member dedicated to analysis and reporting.
The stakeholders (management, staff, parents, students) are identified, informed, and included in the schedule. The test roadmap is updated to synchronize them over six weeks, with validation milestones and opportunities to share lessons learned.

Once the tests have been planned and validated, it is time to deliver. Delivering, in this case, does not mean delivering a finished product, but making operational what will enable learning: the purpose of the test.
Each test becomes a mini-project, with its own resources, deliverables, and internal validations.
1. Specify the test
Before any design work begins, the team formalizes the framework for each experiment. This specification acts as a contract between intention and execution. Depending on the nature of the test, it takes different forms:
- a design brief for the creation of a prototype (objectives, context, audience, constraints, success criteria);
- a protocol sheet describing the course of a field test (location, duration, equipment, instructions, identified risks);
- a user story for technical development (“As a chef, I want to see how much food is thrown away each day so I can adjust my preparations”);
- an interview or focus group plan for qualitative discussions;
- a workshop template for co-ideation sessions.
These documents ensure consistency among all project stakeholders and allow hypotheses to be validated before anything is produced.
2. Design and prepare resources
Different resources are then created for each selected test:
- Immersive observation in the cafeteria
- Preparation of an observation questionnaire and a table for tracking the quantities consumed per student.
- Coordination with teachers to plan the six days.
- Logistical checks: authorizations, schedules, note-taking materials.
- Interview with the cafeteria manager
- Creation of a semi-structured interview guide and a collaborative note-taking file to centralize feedback.
- Organization of the meeting and sharing of the minutes in the project space.
- Collective ideation workshop
- Open a FigJam account and design a mock-up workshop template with two team members (three successive iterations for improvement).
- Send a Doodle poll to find a date that works for all participants (staff + parents).
- Prepare facilitation materials (rules of the game, idea canvas, timer, summary sheet).
3. Implement and verify before operating in the field
Before any deployment, the team accepts its deliverables. Each resource is tested under simulated conditions:
- Does the questionnaire work without ambiguity?
- Does the collection file comply with the expected formats?
- Is the FigJam template fluid and understandable?
- Are the success indicators measurable at the end of the test?
This adjustment stage, which is sometimes overlooked, guarantees the reliability of future learning: a poorly prepared test produces unusable data. In a more advanced project, this phase could have included the implementation of an interactive prototype or a measurement dashboard in a real-life situation.
The purpose of the delivery is not the deliverable itself, but the production of knowledge that will inform future decisions to move forward.

D-day finally arrives. After weeks of preparation, framing, and design, the team springs into action: it’s time to run the tests. This is the phase where hypotheses are tested against reality, where concrete signals are collected, and where theory takes shape. The team must not only execute, but also observe without interfering, document without distorting, and listen without trying to convince.
Test 1 — Observing meals with students
From the very first lunchtime, two team members discreetly settle into the cafeteria.
Their goal: to understand without judging.
A hand-printed questionnaire serves as their guide.
On a chart prepared in advance, they note what each student ate, what was left over, and what they enjoyed.
Between bites, they strike up a conversation:
“How was it today?”
“Meh, the beans are cold.”
“And did you eat your dessert?” ”
The exchanges are short, sincere, and sometimes funny.
Each meal becomes a goldmine of observations: portions too large, dishes lukewarm, not enough time to finish.
In the evening, the notes are entered into the shared table: the raw data accumulates.
Test 2 — Interview with the cafeteria manager
The next day, a member of the team meets with the manager in his office.
The interview is guided by a discussion guide prepared in advance.
The manager explains:
“We’ve already tried reducing the quantities, but the parents complained.”
“The suppliers won’t let us change the menus; it’s in the contract.”
“The staff do what they can, but we lack stability in the team.” ”
Everything is noted in the collaborative file created for this purpose.
The tone is frank and pragmatic. The team discovers that some causes are structural and beyond their immediate control.
But they also note concrete courses of action: communication, training, awareness-raising.
Test 3 — Collective ideation workshop
A few days later, in the staff room, the team leads an ideation workshop with the cooks, staff, and two volunteer parents. A FigJam template projected on a screen serves as a support.
The workshop begins with a quick roundtable discussion: “What frustrates you the most? “
Ideas flew:
- ”The children don’t have enough time to eat!“
- ”We throw away whole dishes just because they aren’t served on time.“
- ”If we could adjust the portions, that would already be a huge help.”
Three rounds of ideation later, the virtual Post-its formed a cloud of possible actions.
The team facilitates convergence: each participant votes for the levers they consider most promising. A confidence score is assigned to each idea. The session ends in a lively, almost joyful atmosphere: everyone feels they have contributed.
Operate according to the nature of the test
- For a field test (observation, interview, survey)Team members are deployed to the site. Questionnaires are administered, responses are recorded, and behaviors are observed. Data is entered into the appropriate tables, and discussions are rigorously documented. The goal is to collect raw facts, not opinions.
- For a workshop (ideation, co-construction, focus group)The facilitator leads the session according to the defined protocol: introduction, rules of the game, brainstorming, convergence. Participants express themselves, debate, vote, and the team captures everything in real time on FigJam. Here, the operation consists as much of bringing out ideas as it does of measuring collective dynamics: level of engagement, confidence, perceived relevance of levers.
- For software or a prototype put into productionThe operation corresponds to the launch or commissioning of the product. The environments are configured, the test data is replaced by real data, and users begin to interact. The logs, analytical indicators, and user feedback become the raw material for learning. The team monitors the behavior of the system, anticipates anomalies, and ensures operational maintenance throughout the test.
A posture of listening and precision
Operating is not just about “running” the test, but about experiencing it methodically.
Each member has a role:
- the facilitator guides without influencing,
- the observer records facts and weak signals,
- the analyst verifies the consistency of the data collected,
- the coordinator handles logistics and relations with stakeholders.
Everything is done to preserve the reliability of the signal. Biases are identified, discrepancies noted, and impressions recorded immediately. Raw data takes precedence over interpretation.
During the meals observed, the team carefully notes the quantities consumed, leftovers, and children’s comments. The data is immediately entered into a shared table, standardized to avoid confusion: each row corresponds to a student, each column to a variable—dish served, meal time, quantity consumed, reason for waste. This rigorous data entry ensures comparability between days.
During the interview with the director, comments are transcribed and then categorized in the shared file: structural constraints, internal levers, contractual limitations. The goal is that nothing is lost, neither the figures nor the nuances.
In the ideation workshop, the results take the form of digital post-its, votes, and verbatim quotes. This qualitative data is exported from FigJam to a shared space: it is living material, ready to be analyzed.
Once the tests have been carried out, it is time to measure what actually happened.
This is a decisive step, often silent but essential: the one where observations are transformed into usable data. Measuring, in this case, is not limited to “taking notes” — it is about capturing the signal of reality, making it reliable and shareable.
Measuring over time
Not all data begins at the start of a test and ends at the end of a test. Some continues to occur in a continuous stream:
- Feedback provided by agents in the days following the test.
- Repeated observations on meal consumption.
- And, in another context, software data: server logs, usage metrics, alerts, success or failure rates.
In a more technological setting, this continuity of measurement is ensured by monitoring tools or analytical dashboards, which automatically capture the behavior of the system. In the cafeteria, it relies on human discipline: a table to fill out, an observation ritual to repeat, regular monitoring.
Ensuring data quality and traceability
Measuring also means ensuring that the data remains usable.
The team checks:
- that the files are complete and correctly named,
- that sensitive data is anonymized,
- that observation materials (photos, notes, verbatim transcripts) are centralized in the same space,
- that each test is accompanied by a summary of the context (date, place, conditions, any incidents).
This discipline prevents the “loss” of learning between the field and analysis. The data manager ensures that everything is archived and shared with the members who will process the results. Each test now produces a clear footprint, ready to be compared, cross-referenced, and interpreted.
Once the data has been collected, the team meets to compare the observed reality with the initial strategy. Tables are displayed, verbatim reports are reread, photos and graphs are spread out on the table. Little by little, discrepancies emerge. Some assumptions are confirmed, others collapse, and several gray areas require further clarification.
The initial findings are telling:
- Students do not reject food because of its quality, but because they lack time to eat.
- Staff want to adjust portions, but supplier contracts block flexibility.
- Cooks lack information on the quantities to be prepared, but have no desire to improve.
- Parents and staff share the same goal, but there is no channel for them to act together.
These findings show that waste is not just an operational problem: it is a system of misaligned constraints. The team then realized how much their mission—to “reduce waste”—went beyond simple food choices.
It touched on governance, communication, and even educational culture.
Based on these findings, several avenues opened up:
- Redefine the vision, incorporating the cultural and collective dimensions of the problem.
- Revise the strategy, targeting levers of influence rather than visible symptoms.
- Launch a new series of tests, this time focused on co-constructing a concrete solution (monitoring tool, display system, menu management application, etc.).
Formulate new hypotheses, for example:
- “If waste data is displayed daily to everyone, collective behavior will naturally evolve.”
- “If canteens have an instant feedback tool, they will be able to adjust their menus in real time.”
This inventory work marks a return to the starting point, but with a more refined, deeper, and more systemic understanding.

The role of Discovery and Delivery
In agile product management, there are traditionally two main phases: Discovery and Delivery. The first phase involves exploration: understanding needs, formulating hypotheses, imagining solutions, and testing approaches. The second phase involves execution: designing, developing, deploying, and maintaining features in production, within a real operating environment subject to service level agreements (SLAs).


In other words, Discovery seeks to determine whether to build, while Delivery ensures that what is built works and creates value.
But in the logic of an impact factory, this separation becomes relative. Discovery and Delivery are not two separate worlds: they share the same learning cycle, consisting of the same steps—orient, identify, frame, plan, deliver, operate, measure. The difference lies not in the method, but in the nature of the test.
- If the delivery of the test takes place in a production environment, with real users, measurable impacts, and operational constraints, then it is Delivery.
- If the delivery of the test remains in an exploratory framework—models, prototypes, simulations, studies, or experiments without production—then we are in Discovery.
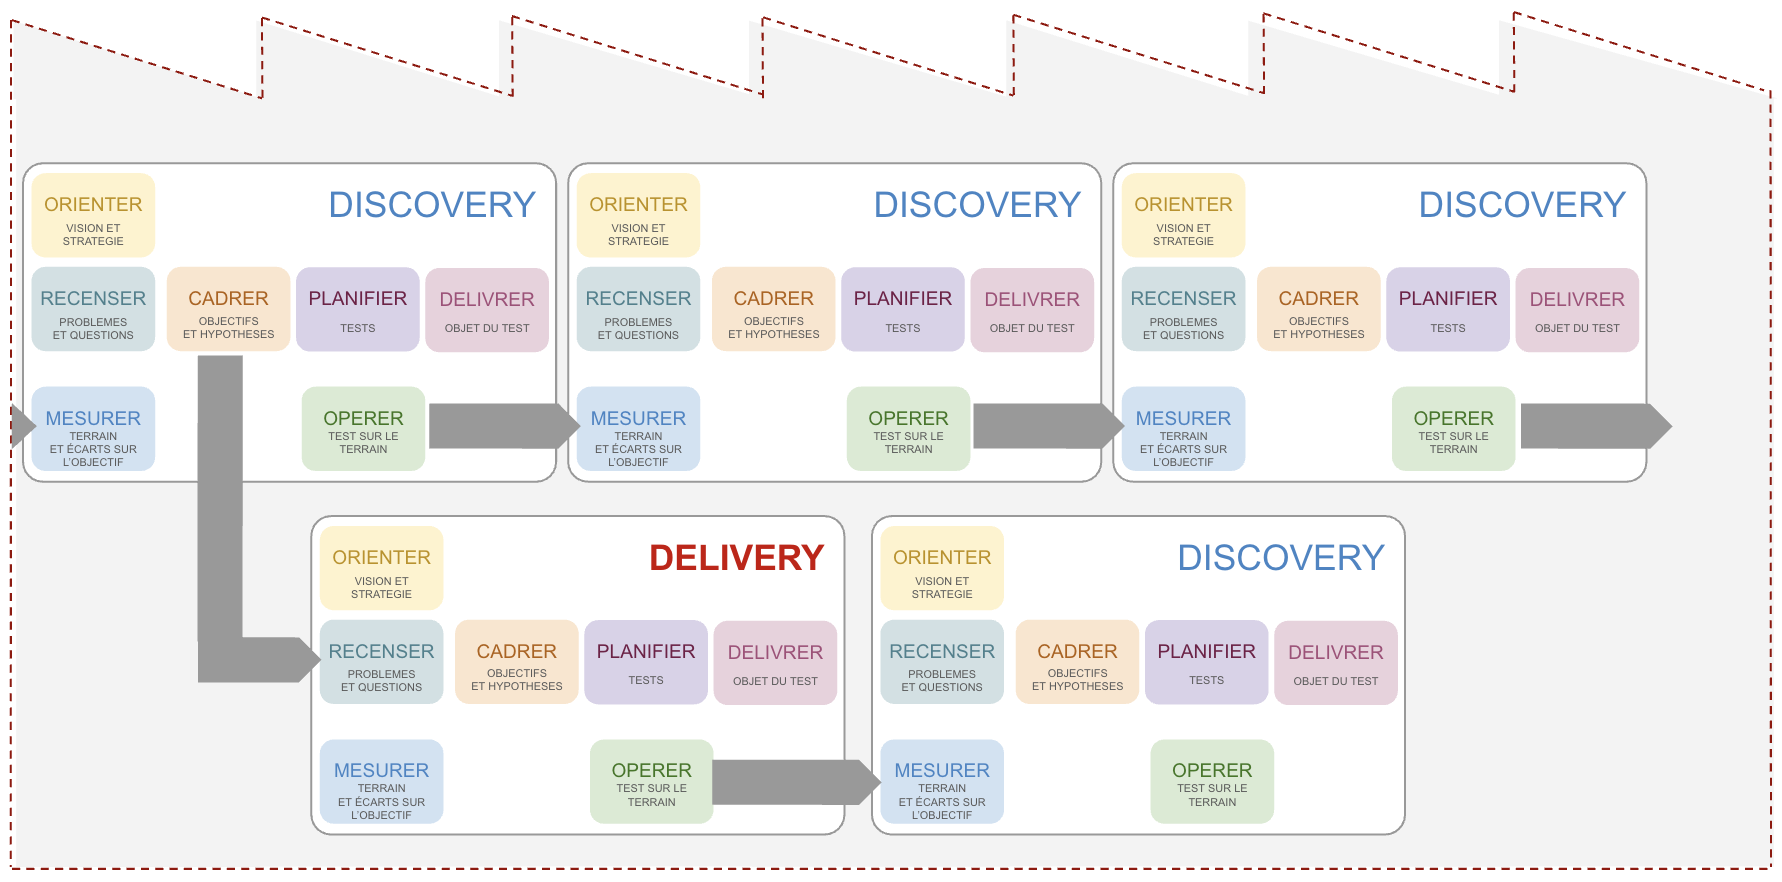

In both cases, the principle is the same: we test to learn. The loop is identical, only the scope of the test changes. This is why, in the impact factory model, the verb “Deliver” is not limited to “Delivery” in the traditional sense. It refers to the delivery of test material, whether or not it is deployed in production.
In other words, our “Deliver” applies equally to a research mock-up and an online feature: in both cases, it’s about learning, measuring the gap, and adjusting the trajectory to maximize impact.
Similarly, in the traditional model, we also distinguish between Build and Run.
Build corresponds to the construction phase: designing, developing, and delivering new features, products, or services. Run, on the other hand, concerns the day-to-day operation of the system: monitoring, maintaining, correcting, ensuring service continuity, and user satisfaction. In other words, Build creates value, while Run preserves it. In an impact factory, this separation is blurred in favor of a common logic: everything is part of the same cycle of continuous improvement. Run activities are no longer seen as simply maintaining operational conditions, but as a valuable source of data to guide future learning.
Similarly, Build activities are not one-off production phases, but experiments designed to be measured, evaluated, and enriched by what Run reveals. An anomaly in Run becomes a hypothesis to be tested in Build; an innovation in Build becomes a new field of observation in Run. On the other hand, it is clear that Build and Run are associated with Delivery.
The dilemma of product role boundaries
It is therefore clear that it is no longer simply a matter of dividing roles according to the traditional model, where the Product Manager and Product Designer focus on Discovery, while developers, guided by a Product Owner, take care of Delivery. In an impact factory, the boundaries between these areas become blurred and, above all, more systemic.
The reality is that each phase—whether exploratory or in production—requires specific skills depending on the nature of the test to be conducted. A usage test on a high-fidelity prototype, for example, can be led by a Product Designer, accompanied by a UX Researcher for the implementation and analysis of user feedback. A market appetite, positioning, or pricing test will be more the responsibility of the Product Manager, supported by a Growth or Data Analyst for the interpretation of signals. And a technical or performance test in a real environment will naturally be the responsibility of a developer or Tech Lead, who designs the instrumented solution to collect the data needed to measure impact.
In other words, it is no longer the phase of the project or sequence that defines who works with whom, but the nature of the problem and the test. Each question finds its natural owner according to the skills required: understanding the need, designing the solution, experimenting, analyzing data, or putting it into production. Product leadership is then distributed dynamically, according to the learning challenges of the moment.
This paradigm shift reveals another often underestimated reality: in terms of workload, product roles (PMs, designers, data scientists, researchers) produce as much as developers, but in other forms of deliverables—hypotheses, prototypes, mockups, surveys, analyses, decision frameworks. Their output is no less tangible: it feeds knowledge and reduces risk before a single line of code is written.
As a result, the so-called Discovery and Delivery teams tend to be comparable in size and, above all, highly interdependent. One discovers what the other needs to build, the other validates what the first has learned. The goal is no longer to separate flows but to synchronize them to maximize the overall performance of the system.
In an impact factory, this symmetry becomes a structural advantage: each cycle, whether Discovery or Delivery, contributes to the same learning loop.
The result is an organization that is more fluid, more intelligent, and above all, more efficient than traditional models—not because it works harder, but because it learns faster.
The complexity then lies more in the sequencing and the right choice of activity management tools.
The relativity of granularity
In an impact factory, everything is designed as a test, regardless of the scale of the activity. This approach applies not only to spectacular product experiments, but also to the most everyday actions in team life.
A test is an action structured around a measurable objective, an explicit hypothesis, and a measurement loop that allows lessons to be learned.
This logic applies at several levels, which fit together like Russian nesting dolls:
- At the strategic level, the viability of a model or direction can be tested. For example, a company can launch a Proof of Concept on AI technology to verify whether it can reduce customer processing costs by 30%. The cycle is long, the hypotheses numerous, but the logic remains experimental: we formulate beliefs, measure their validity, and adjust the trajectory.
- At the operational level, the activities themselves become tests. The ideation workshop organized to imagine the interface is not neutral: it too has a measurable objective, for example, to generate five usable concepts in less than an hour. If this objective is not achieved, the test fails—and a new activity is planned: inviting a UX expert, exploring other facilitation methods, or conducting user interviews.
At an even finer level of granularity are atomic tests, the daily micro-experiments that punctuate the life of a team: a meeting designed to resolve a blockage, a message tested to elicit more feedback, a quick exchange with a customer to validate an intuition. The strength of the impact factory lies in this continuity of experimental logic, from the most ambitious project to the most mundane task. Every activity, every meeting, every decision becomes a measuring point on the collective trajectory—a way to learn faster than others.
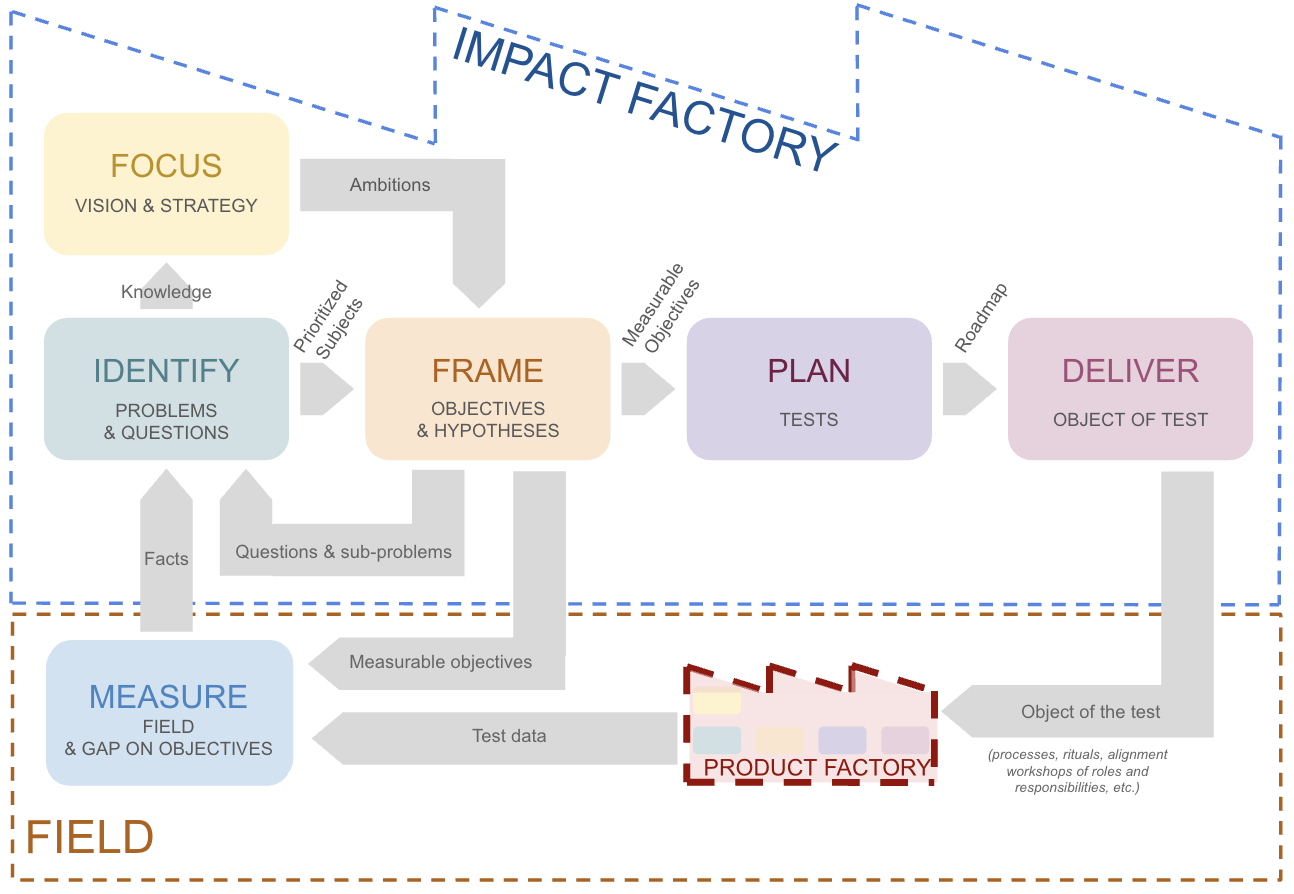
The impact factory
At the heart of the factory, this time, is the team itself. An agile team that not only manufactures a product, but also builds its own way of working every day.
Its goal is simple: to produce better and better, i.e., to be both more effective in creating value and more efficient in the use of its energy, time, and resources.
It begins by focusing its improvement approach. Together, the members define a clear vision of what they want to become: a fluid, autonomous, and value-centered team. They establish a strategy for change, often inspired by Lean principles, where the search for what is necessary guides their choices.
Then comes the time to identify everyday problems and irritants. The team observes its rituals, deadlines, dependencies, interruptions, and wastes of time or energy. Everyone formulates questions that hinder collective performance: Why do certain tasks stagnate? Why do certain decisions get lost along the way?
The team then sets about framing its priorities. It transforms its findings into specific objectives and hypotheses for improvement. For example: if members share obstacles at the end of each sprint, problems will be dealt with more quickly; or if we limit work in progress, delivery will be smoother.
The team can then plan its improvement tests. Actions to be attempted are identified and ranked by impact and feasibility. The team defines the observation period, the criteria for success, and how the results will be shared.
Next comes the time to deliver the test object. A new practice is implemented: a shorter and better-prepared stand-up meeting, visualization of the workflow, measurement of cycle time, or better prioritization of tasks.
The team then moves on to operating. It actually applies this new practice during a sprint, observing the effects on group dynamics, morale, speed, or the quality of deliverables.
Finally, it takes the time to measure. The data is compared to the initial strategy. The differences identified, whether positive or negative, become learning opportunities. Successes are consolidated, failures serve as benchmarks, and the next improvement loop can begin.

Human balance
Let’s go back to our house in winter. The thermostat ensures that the ideal temperature of 19°C is maintained. It constantly compares the setpoint with the actual temperature before adjusting the command sent to the heating system. But this house is not just made up of walls and pipes: there are people in it.
In an impact factory, it is not the thermostat that regulates the temperature, but the people who adapt their activities. It is the teams who observe, interpret, and constantly adjust the system to maintain the balance between performance, meaning, and well-being. They ensure that the three imbalances described by Lean Management are regulated: Muda, Muri, and Mura.
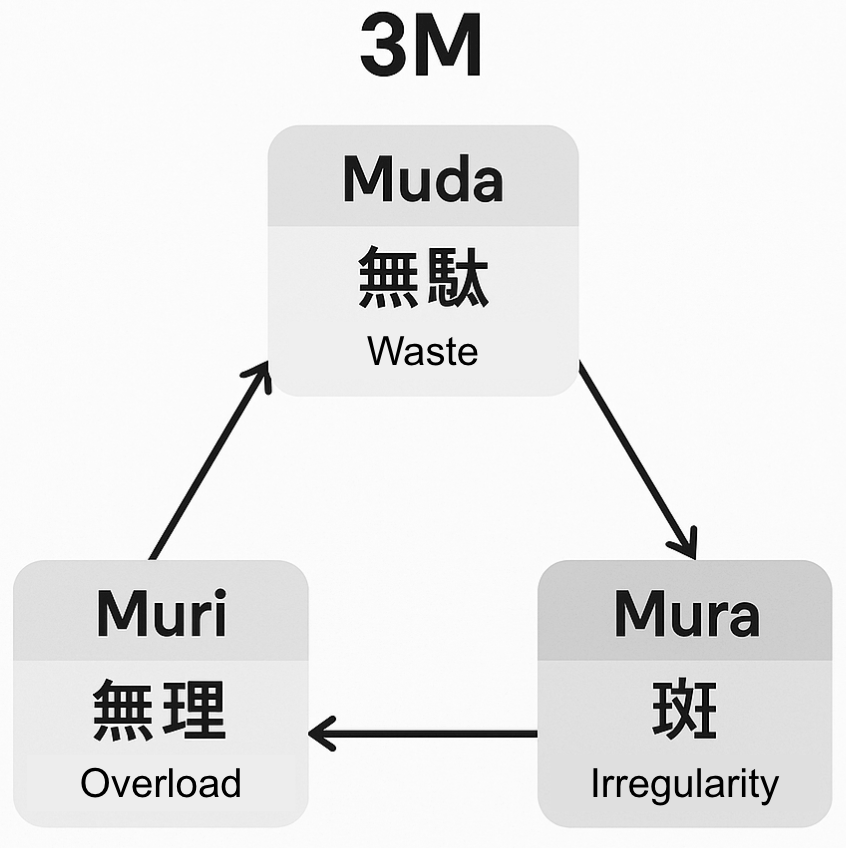

Muda represents the waste of human energy: useless work, meetings without decisions, efforts that serve no one. This is the P in PID. It embodies collective responsiveness: when a team feels that energy is being wasted, it immediately adjusts its approach to focus its efforts on real value.
Muri reflects overload, when people or systems exceed their limits. It is the radiator that is pushed too hard, or the team that is exhausted by excessive demands. It is the equivalent of the integral regulation I of PID, which smooths out these excesses.
It draws on collective memory: retrospectives, feedback, lessons learned from previous sprints. It helps to better calibrate the load and preserve the health of the system—and those who keep it alive.
At the product level, these are the tools that allow demand to be regulated in order to focus on activities that have an impact in terms of production capacity.
Finally, Mura refers to irregularity, variations in pace and intensity that destabilize both humans and processes: peaks in activity, changes in priorities, vague expectations. It is Derivative (D) regulation that acts here as a form of organizational sensitivity. It allows tensions to be anticipated before they erupt, weak signals—fatigue, demotivation, misalignment—to be detected, and the workflow to be adjusted before imbalance sets in.
In an impact factory, this human PID does not simply maintain a stable temperature: it seeks a sustainable collective climate, where everyone contributes to the overall balance. In this way, the organization becomes a living organism that is unstable by definition, constantly seeking balance in order to best serve its mission over time. It moves forward not by forcing, but by agreeing.
Quality is built into the process. This process guarantees both the relevance of the chosen course and the viability of the approach, in the short and long term.
The impact factory brings forth meaningful products (goods or services, and the system surrounding them), recruits and leads committed teams, and implements governance tailored to its mission. It cultivates continuous questioning, learns from its successes and mistakes, and relies on a community that values people, passion, and a taste for challenge.
Each factory evolves according to its own maturity, reflecting its history, its choices, and the depth of impact it seeks to achieve.


Author of Impact Factories / Co-founder of Shy Robotics and Product Whys / Head of Product at Dassault Systèmes / Engineer passionate about innovation and entrepreneurship
Full bibliography here


